HCOVG logo
  • Software Home
    • RodHome..
  • Premium software
    • GEOrient
    • GeoCalculator
    • Purchase
    • Installation, etc
  • GIS Tools
    • GeoQSymbol for QGIS
    • GeoMapSymbol for Mapinfo
    • GeoMapVector for Mapinfo
    • PolyNodeExtractor for Mapinfo
  • Other Software
    • Strain & Shear Calculator
    • Ghoshflow
    • GeoFryPlots
    • Teaching animations...
  • Contact me
Rod Holcombe logo
  • Software Home
    • RodHome..
  • Premium software
    • GEOrient
    • GeoCalculator
    • Purchase
    • Installation, etc
  • GIS Tools
    • GeoQSymbol for QGIS
    • GeoMapSymbol for Mapinfo
    • GeoMapVector for Mapinfo
    • PolyNodeExtractor for Mapinfo
  • Other Software
    • Strain & Shear Calculator
    • Ghoshflow
    • GeoFryPlots
    • Teaching animations...
  • Contact me

Fry Plots

GeoFryplots_screenshot_image

GeoFryPlots©

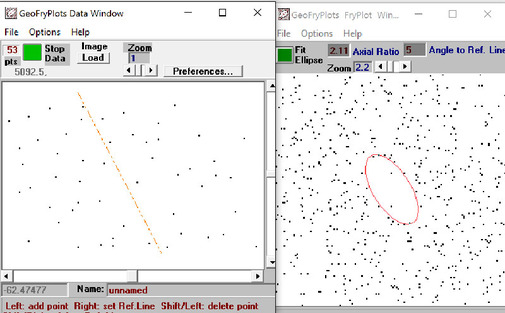
is an interactive graphical interface for analysing 2D finite strain using the Fry (1979) point-to-point method.
[The left hand pane in the image here shows the digitised raw distribution of points in a plane ; the dashed red line is the orientation of the principal stretch in this plane as determined by the Fry analysis in the right hand pane.
Download...
Free [~2.4 mb]
Installation...
Disclaimers...

What it does
  • GeoFryPlots uses the Fry (1979) point-to-point method to analyse the orientation distribution of near-neighbours within a cluster of points in a 2D plane. It computationally mimics the manual method described by Fry (1979) in which, successively, every point in the cluster takes the central position and every other point is plotted relative to that position. The result is to produce a plot, generally with a void in the centre, and a radial symmetrical distribution of points around that centre. The radius of the void in any direction reflects the minimum distance between neighbours in that direction. Effectively, in deformed rocks, a Fry plot shows the relative stretch in all directions within the plane being analysed, provided that the original neighbouring pairs of points were more or less equally spaced in all directions through out the plane.
  • Data can be either read in from an ASCII file (as pairs of x,y coordinates) or can be digitised directly into a data window using the mouse. Bitmap images to be digitised can be loaded into the data window from file. Fry plots are displayed in a separate FryPlot window within which a best-fit strain ellipse to the plot can be constructed using the mouse. Data and plot windows can be printed or copied to the clipboard, and digitised data can be saved to file. - see bugfix history for most recent changes. 
  • The screenshot image above shows the distribution of feldspar porphyroclasts in the XY plane of finite strain of a gneissic granitoid. The data was digitised from an image of the face in outcrop, which was then loading into the plot. Digitising was simply a case of clicking the mouse on the centre of each porphyroclast grain in the image.


Download
GeoFryPlots_zip.exe
Self-extracting zip file (.exe) containing the full set of installation files [~2.4 Mb]


Notes
  • The software is specific to Microsoft Windows. (It may install and run under Windows emulations, although Help links within the application will not work).
  © Rod Holcombe 2021         [Based on a free web site created at Weebly]